MAP: COVID-19 Hits Tucson Tourism, Rebound Hopeful
The economic consequences of the COVID-19 pandemic have impacted industries and occupations unequally. Since the beginning of the pandemic, it was strikingly clear that the travel and tourism sector would be disproportionally affected. This in turn has significant implications for tourism-dependent regions of the world.
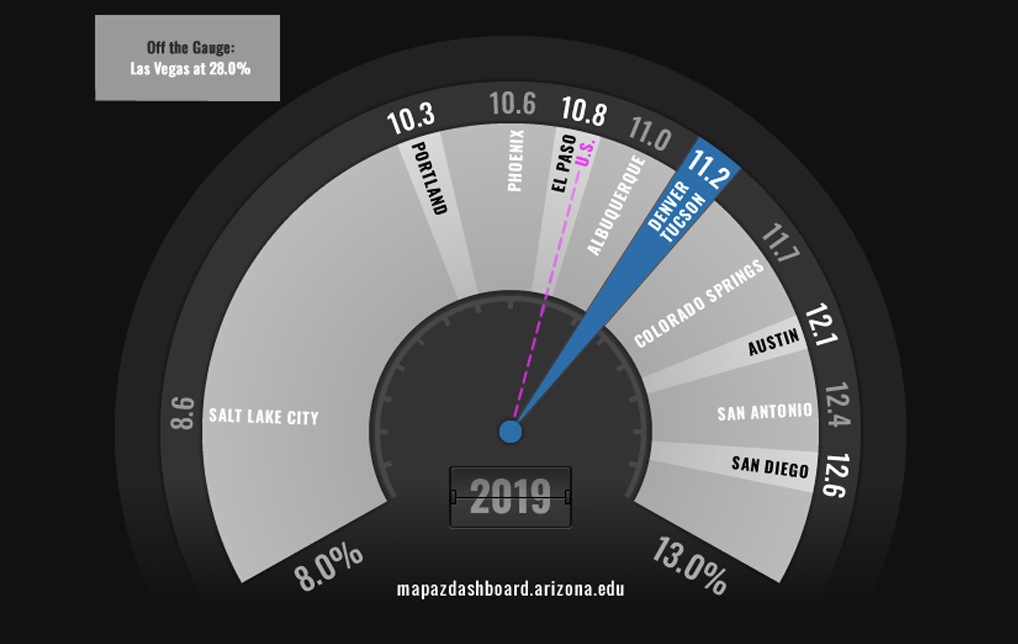
A recent article on the MAP, “How Exposed are Tucson’s Industries to a COVID-19 Recession” explored how leisure & hospitality jobs in Tucson may be impacted by a COVID-19-induced recession. For reference, in Tucson during 2019, there were 44,617 jobs in the leisure & hospitality sector accounting for 11.2% of total employment. Figure 1 highlights how Tucson compares among peer metropolitan areas in leisure & hospitality employment. This article takes a deeper look at how the leisure & hospitality sector, and tourism in general, have weathered the downturn. Tucson in this article refers to the Tucson Metropolitan Statistical Area (MSA), which is the same geographic region as Pima County.
In Tucson, during the second quarter (April – June) of 2019, there were approximately 45,000 jobs in the leisure & hospitality industry. The leisure & hospitality industry is made up of arts, entertainment, recreation; accommodations; and food service jobs. Of the 45,000 leisure & hospitality jobs in Tucson, 90% of them were in accommodation and food services.
In Tucson, jobs in the leisure & hospitality industry declined by 20.1% between the 2nd quarter of 2019 and 2020 (Figure 2). When broken down by sub-sector, there was an 8.4% decline in arts, entertainment, and recreation jobs, a 32.1% decline in accommodation jobs, and a 19.3% loss in jobs in food services and drinking places. Leisure & hospitality jobs fell at an even faster pace in the Phoenix MSA, with a particularly rapid drop for the arts, entertainment, and recreation sector.
Figure 2: Employment by Industry, Over-the-Year Percent Change in the Second Quarter of 2020
There was significant variation in leisure & hospitality employment performance among Arizona’s metropolitan areas in the second quarter of 2020. The Flagstaff MSA posted the largest percentage decline over the year, with employment losses of 54.7% (Figure 3). The Lake Havasu City – Kingman MSA wasn’t far behind with job losses of 43.2%. The Prescott MSA reported the least job losses among the Arizona MSAs at 8.5%.
Figure 3: Leisure & Hospitality Employment by Arizona MSA, Over-the-Year Percent Change in the Second Quarter of 2020
Among peer western metropolitan areas, Tucson posted the lowest decline in jobs in the leisure & hospitality during the downturn at 20.1% (see Figure 4). Portland reported the largest decline in employment between the 2nd quarter of 2019 and 2020 with job losses totaling 47.4% in leisure & hospitality.
Figure 4: Leisure & Hospitality Employment by Peer Western MSA, Over-the-Year Percent Change in the Second Quarter of 2020
The Arizona Office of Tourism reports quarterly and monthly data on lodging and airport passenger traffic. The hotel and airline industry have both been significantly impacted by the COVID-19 downturn. They are among the hardest-hit sectors along with restaurants and bars.
In Arizona during the 2nd quarter of 2020, Coconino County (Flagstaff MSA) posted the lowest lodging occupancy rate at 33.9% which was a 60.5% decline from the 2nd quarter of 2019. Pima and Maricopa counties also reported low occupancy rates at 34.3% and 36.0%, respectively. Mohave and La Paz counties posted the highest lodging occupancy rates at just over 50%.
Figure 5 highlights the lodging occupancy rates for the Arizona counties. For reference, during the 2nd quarter of 2020, the lodging occupancy rate for the U.S. was 33.5%, and Arizona’s statewide rate was 37.4%.
Figure 5: Lodging Occupancy Rates (2nd Quarter 2020)
The MAP Dashboard tracks annual changes in Tucson International Airport’s (TIA) departures per day and seats per capita compared to peer western MSAs. These data are updated annually. However, given the significant impact that the COVID-19 pandemic has had on the airline industry, it is an important indicator to track at a higher-frequency. Regularly updated weekly data for TSA traveler throughput at U.S. airports can be found on Arizona’s Economy.
The Arizona Office of Tourism provides monthly passenger traffic reports for all Arizona airports. In April of 2020, all Arizona airports with the exception of Show Low Regional posted a reduction in passenger enplanements/deplanements over 90%. For example, in April 2020 TIA had 19,812 passengers compared to 338,785 in April of 2019 that was a decline in passengers of 94.2%.
The airline industry continues to be one of the hardest-hit sectors. However, there has been a slight improvement in passenger traffic since April. As illustrated in Figure 6, TIA posted a reduction in domestic enplanements/deplanements of 94.2% in April when compared to the previous year. In May, the reduction of passenger traffic compared to the previous year was down to 85.3%, followed by a further reduction in June and July to 70.8% and 66.3% respectively. Results were similar for Phoenix Sky Harbor, as Figure 6 shows.
Obviously, there is still a long way to go till passenger traffic is back on track with previous years. For instance, in July of 2020, 95,210 passengers traveled through TIA compared to 282,200 the previous year.
Figure 6: Percent Change in Domestic Passenger Enplanements/Deplanements
https://www.ebrc-charts.com/MAP-charts/Feature_Articles/COVID%20Tourism/AirTraffic.html
Overall, the travel and tourism sector remains hard hit by the pandemic, particularly those industry segments that rely on business customers flying in from long distances (such as attending meetings/conferences). The restaurant and bar sector remains subject to reduced seating requirements and other restrictions as well as customer reluctance to return to pre-pandemic activities while the virus remains prevalent. Arts, entertainment, and recreation faces similar obstacles to full recovery. While conditions in the travel and tourism sector remain difficult, it is likely that the industry will rebound rapidly once we have effective therapeutics and a vaccine.


